
The borough average jumped £7,593 in a month to £456,227 in July, its first annual rise since March. Semis and terraces up, flats still falling.
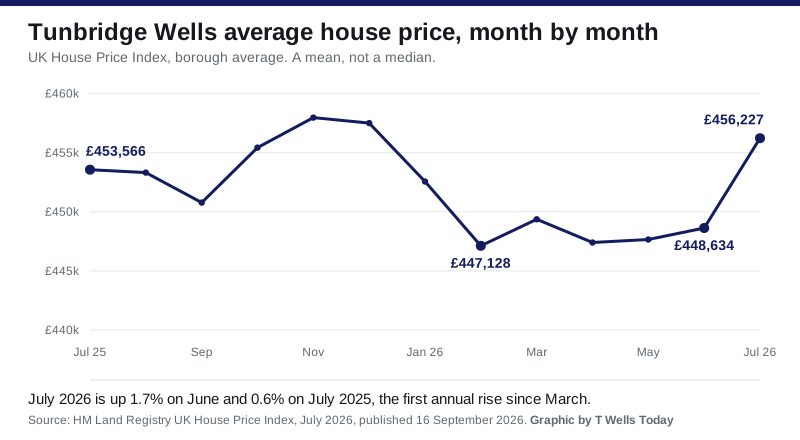
Tunbridge Wells house prices went back up in July. The borough average reached £456,227, a rise of £7,593 in a single month and £2,661 on July last year, according to the UK House Price Index for July 2026, which HM Land Registry published on 16 September.
That 0.6 per cent annual rise is the first this borough has recorded since March. Prices here fell on the year in April, May and June. The 1.7 per cent monthly jump is the largest since April 2025.
One caution before the numbers. The UK House Price Index average is a mean, worked out by a statistical model, and it is pulled upwards by a small number of very expensive sales. It is not the price of a typical home. The middle completed sale in this borough over the twelve months to June 2026 was £430,000, which is the figure on our Tunbridge Wells house prices page.
June was not as bad as we were told
When the June figures came out on 19 August, the borough average was published as £445,133, down 3.0 per cent on the year, and Tunbridge Wells was the only one of Kent’s 13 local authority areas lower than it had been twelve months earlier. We reported that at the time.
The July release restates June as £448,634, down 2.3 per cent on the year. That is £3,501 higher than the first published figure.
This is normal and it is worth understanding, because it happens every month. The index is built from completed sales as they are registered, and registration lags the sale. Each release adds the sales that arrived late and recalculates the earlier months. The last two months of any release are the least settled, which is why the July figure published this month will itself move.
What moved, and what did not
Two of the four property types are now rising clearly, and flats are still going backwards.
| Property type | July 2026 average | Change on the year |
|---|---|---|
| Detached | £869,817 | +0.7% |
| Semi-detached | £505,060 | +2.0% |
| Terraced | £407,999 | +1.6% |
| Flat | £258,513 | -2.0% |
Flats have been the weakest type here all year, and a 2.0 per cent annual fall takes the average flat to £258,513. The gap between the average flat and the average detached house in this borough is now £611,304.
For buyers, the index puts a first-time buyer purchase at £350,900 in July, up 0.6 per cent on the year. Somebody selling one home to buy another paid £572,615. That step of £221,715 is the practical barrier for anyone trying to move up inside the borough.
How that compares with the rest of Kent
Tunbridge Wells is still near the bottom of the county table on annual change, even after July’s rise. Only Maidstone and Dartford did worse. It remains the second most expensive place in Kent to buy, behind Sevenoaks.
| Area | July 2026 average | Change on the year |
|---|---|---|
| Gravesham | £344,923 | +3.3% |
| Swale | £298,985 | +3.2% |
| Canterbury | £337,454 | +2.9% |
| Dover | £277,750 | +2.7% |
| Thanet | £269,708 | +1.8% |
| Ashford | £347,562 | +1.4% |
| Tonbridge and Malling | £407,880 | +1.4% |
| Medway | £298,547 | +1.1% |
| Sevenoaks | £538,714 | +1.0% |
| Folkestone and Hythe | £303,296 | +0.9% |
| Tunbridge Wells | £456,227 | +0.6% |
| Maidstone | £352,722 | -0.1% |
| Dartford | £347,773 | -2.0% |
England as a whole averaged £293,479 in July, up 1.1 per cent on the year.
The longer view is less cheerful than a single month’s jump suggests. The index is set so that 2023 equals 100. Tunbridge Wells now reads 100.6 against England’s 102.7, so prices here have barely moved past where they stood three years ago while the country as a whole has moved further. The borough’s highest recorded month remains December 2022, at £471,251. July’s average is still £15,024 below that, a fall of 3.2 per cent over three and a half years.
How many homes are actually selling
Not many, on the most recent figures we have.
The Land Registry has not yet published a sales count for June or July, because too few of those sales have been registered. The last month with a figure is May 2026, at 89 recorded sales, against 131 in May 2025. April 2026 shows 95, and February and March 2026 show 102 and 109.
Treat those as a floor rather than a total. Recent months get revised upwards as registrations catch up, the same way prices do.
The comparison with last year is not a clean one either. March 2025 shows 304 recorded sales in this borough and April 2025 only 76, a spike and a collapse either side of 1 April that dwarf anything in 2026. Set those two months aside and the pattern is still a thinner year: 100 sales in January 2026 against 115 in January 2025, and 89 in May against 131.
What it means for you
- If you are selling, the month’s rise does not undo the year. A home worth the borough average is still £15,024 short of what the index says it would have fetched at the December 2022 peak.
- If you own a flat, you are in the one part of this market still falling. The average flat is down 2.0 per cent on the year, while semis are up 2.0 per cent.
- If you are buying, the index average is not your asking price. Use the median for your parish, which we publish by parish, ward and postcode on the house prices page, and check the sold prices on your own street.
- If you are challenging a council tax band, none of this helps directly: bands are set on 1 April 1991 values, not today’s. Our council tax bands page explains what the bands actually cost this year.
- Do not treat any single month as a turning point. June was reported as a 3.0 per cent annual fall and is now a 2.3 per cent one. July’s 0.6 per cent rise will be restated next month too.
The August figures are due from HM Land Registry in October.
Sources: UK House Price Index for July 2026, HM Land Registry, published 16 September 2026; the UK HPI full file for July 2026, from which the borough, property-type, buyer-type, sales-volume, index and Kent comparison figures in this article are taken directly; the Land Registry’s own UK HPI browser for Tunbridge Wells; and UK House Price Index for June 2026, published 19 August 2026, for the June figure as first published. The £430,000 median is our own count of completed sales from HM Land Registry Price Paid data, set out on our Tunbridge Wells house prices page.
Have your say