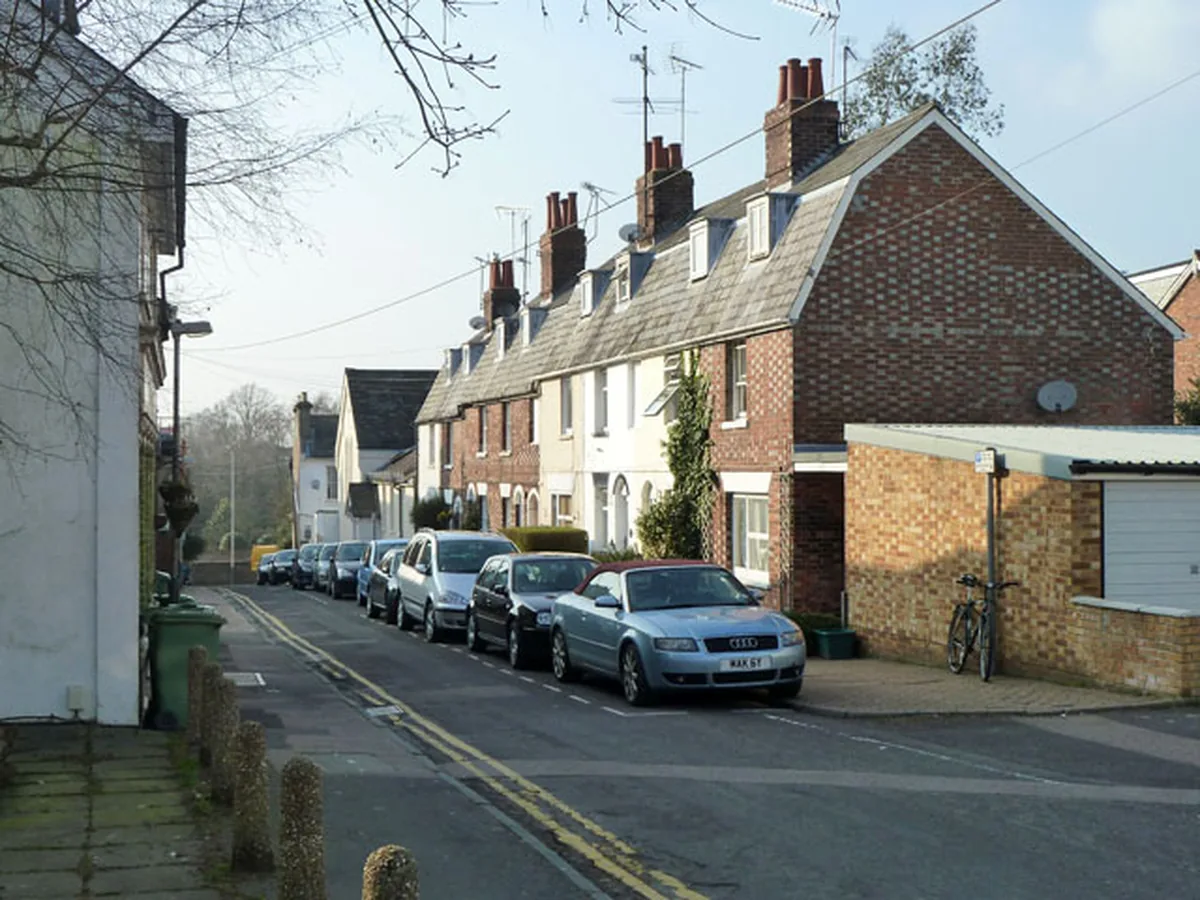

The middle Tunbridge Wells borough home sold for £430,000 in the year to June 2026, and the middle Speldhurst one for £800,000. Prices by parish, ward, type and postcode.
The middle home sold in Tunbridge Wells borough over the last twelve months cost £430,000. In Speldhurst, three miles out on the Sussex side, it cost £800,000. In Rusthall, the next village along the same ridge, it cost £380,000. Those two villages sit in one ward and are £420,000 apart.
Two official figures do different jobs on this page. The £456,227 average you will see quoted elsewhere is the UK House Price Index for the whole borough in July 2026, a modelled mean that is the right thing to watch for direction of travel. It is up 0.6% on a year earlier and up 1.7% on the month, the borough’s first annual rise since March after three months of falls. Everything below at parish, ward and street level is a median of actual completed sales from the HM Land Registry Price Paid record for the twelve months to 30 June 2026, with every postcode matched to its parish so that a Wealden, Maidstone or Tonbridge and Malling address in a shared postcode is not counted as ours. On that basis 1,391 homes changed hands in the borough and the middle one cost £430,000.
That distinction matters more here than in most places. Six of this borough’s eight postcode districts are shared with a neighbouring council, and TN12 and TN17 in particular run well into Maidstone. Of the 1,725 sales the Land Registry recorded across those postcodes, only 1,391 were actually in Tunbridge Wells borough.
What each town and village actually paid
| Place | Median sale | Sales counted |
|---|---|---|
| Speldhurst | £800,000 | 46 |
| Brenchley and Matfield | £575,000 | 31 |
| Pembury | £525,000 | 64 |
| Goudhurst | £513,750 | 24 |
| Horsmonden | £510,000 | 19 |
| Hawkhurst | £446,250 | 62 |
| Capel | £434,500 | 20 |
| Southborough | £433,500 | 134 |
| Royal Tunbridge Wells town | £410,000 | 697 |
| Paddock Wood | £410,000 | 111 |
| Cranbrook and Sissinghurst | £399,500 | 73 |
| Rusthall | £380,000 | 65 |
Royal Tunbridge Wells itself is the ninth dearest of the twelve, and it is where half the borough’s housing market happens. Its 697 sales are more than the other eleven places combined. Southborough, Paddock Wood and Rusthall add another 310, and all four of those places sit at or below the borough median.
So the shape here is the reverse of the one people assume. The town that gives the borough its name and its reputation is not what makes the borough expensive. The villages are: Speldhurst, Brenchley and Matfield, Pembury, Goudhurst and Horsmonden recorded 184 sales between them at medians from £510,000 to £800,000, while the towns sold the volume underneath them.
The borough by property type
| Property type | Median | Sales |
|---|---|---|
| Detached | £785,000 | 346 |
| Semi-detached | £460,000 | 375 |
| Terraced | £370,000 | 329 |
| Flat or maisonette | £250,000 | 341 |
The four types are unusually evenly matched by volume, between 329 and 375 sales each, and unusually far apart on price. The middle detached house cost £535,000 more than the middle flat, and £325,000 more than the middle semi. Almost the entire village and town gap above is that ratio: Speldhurst sells detached houses, Rusthall and central Tunbridge Wells sell flats and terraces.
On the House Price Index, which measures the borough rather than individual sales, three of the four types rose over the year to July 2026 and flats did not. Detached homes averaged £869,817, up 0.7%, semis £505,060, up 2.0%, terraces £407,999, up 1.6% and flats £258,513, down 2.0%. Flats are the only type still falling, and they were a quarter of everything that sold.
Inside Royal Tunbridge Wells
The town recorded 697 sales, half the borough’s market. Split by type it looks nothing like the borough around it:
| Property type | Royal Tunbridge Wells | Sales | Borough |
|---|---|---|---|
| Detached | £920,000 | 116 | £785,000 |
| Semi-detached | £534,000 | 148 | £460,000 |
| Terraced | £417,500 | 158 | £370,000 |
| Flat or maisonette | £260,000 | 275 | £250,000 |
Every single type sells above the borough figure inside the town. The detached houses are £135,000 dearer, the semis £74,000 dearer. The town’s overall median of £410,000 is lower only because of what it sells: 275 of its 697 sales were flats, against 66 flats in the whole of the rest of the borough. Royal Tunbridge Wells is not the cheap part of this borough, it is the flat-selling part of it.
At ward level the range runs from Southborough and Bidborough at £515,500 from 92 sales down to Culverden at £325,000 from 139. Culverden covers the streets immediately north-west of the station and is the borough’s busiest ward for flats. St James’ reads £365,000 from 127 sales and Sherwood £356,500 from 100. Park ward, which takes in the Common and the roads above it, recorded £492,503 from 151 sales, the highest volume in the borough.
The extremes, and where to check your own street
The dearest recorded sale in the borough over the year was a detached house in the TN1 2SH postcode, on the Mount Ephraim side of the Common, at £5,500,000. A semi-detached house a few doors round in TN1 2SL sold for £4,000,000, and a detached house at TN3 0ED in Speldhurst for £3,720,000. In all, 113 homes sold for £1m or more.
At the other end, 102 homes sold for under £200,000, almost all of them flats. The cheapest was a flat in TN2 3FY at £85,500, and flats at £88,000 in TN4 9PJ, £89,000 in TN2 3SW and £90,000 in Southborough and Rusthall followed it.
By postcode sector, TN3 0 (Speldhurst, Langton Green and Bidborough) had a median of £837,500 from 48 sales and TN2 5 (the Pantiles and the roads south) £555,000 from 114. The cheapest were TN1 1 at £293,750 from 64 sales and TN2 3 at £369,000 from 142, both of them town-centre flat territory.
You can check any address yourself, free, on the HM Land Registry price paid search.
Which way the market is going
| Area | Average price | Change over 12 months |
|---|---|---|
| Sevenoaks | £538,714 | +1.0% |
| Tunbridge Wells | £456,227 | +0.6% |
| Tonbridge and Malling | £407,880 | +1.4% |
| Wealden | £391,211 | -0.8% |
| South East | £380,878 | +0.2% |
| Maidstone | £352,722 | -0.1% |
| Ashford | £347,562 | +1.4% |
| Kent | £346,904 | +1.5% |
| England | £293,479 | +1.1% |
Tunbridge Wells is the second dearest district in Kent after Sevenoaks, and it has just come back above where it was a year ago: up 0.6% over the year to July 2026, against +1.1% for England and +1.5% for Kent. July alone was up 1.7%, the biggest monthly rise since April 2025. Only Maidstone and Dartford are still lower than a year ago. We have written that up in full in Tunbridge Wells house prices rise again.
The index number underneath that is the more useful one. With 2023 set at 100, Tunbridge Wells reads 100.6 and England reads 102.7. This borough has only just got back to its 2023 prices; the country went past them some time ago. Sevenoaks, twelve miles up the A21, reads 102.8. The borough’s own high point was December 2022, at £471,251, which is still £15,024 above July’s average.
Buyers, sellers and the step up
The same index splits by buyer. A first-time buyer in Tunbridge Wells borough paid an average of £350,900 in July 2026, up 0.6% over the year. Somebody selling one home here to buy another paid £572,615. That step of £221,715 is the widest of any district in Kent bar Sevenoaks, and it maps onto the parish table almost exactly: it is roughly the distance from a Rusthall median to a Speldhurst one.
If you are buying in Royal Tunbridge Wells, the cheapest routes in are flats and terraces in Culverden, Sherwood and St James’, where the ward medians run from £325,000 to £365,000. Check what is proposed nearby on our Tunbridge Wells planning page first: the borough’s housing target has just risen from 678 homes a year to about 1,098, and the council is looking for sites now.
If you are buying in the borough but not in the town, Paddock Wood matches the town’s median exactly at £410,000, has its own station, and is where most of the borough’s allocated growth is going. Cranbrook and Sissinghurst is £10,500 below it but has no railway at all. What the commute costs from each is on Tunbridge Wells trains to London.
If you are selling, the borough is back above where it was a year ago, up 0.6% against +1.5% for Kent, but it is still £15,024 below its December 2022 peak. Flats are the exception and are still falling, by 2.0% over the year.
Frequently asked questions
What is the average house price in Tunbridge Wells?
The average across Tunbridge Wells borough was £456,227 in July 2026 on the UK House Price Index. The middle completed sale in Royal Tunbridge Wells itself was £410,000 over the twelve months to 30 June 2026, from 697 recorded sales (HM Land Registry Price Paid).
Are house prices in Tunbridge Wells rising or falling?
Rising again, just. Prices were up 0.6% over the year to July 2026 and up 1.7% in the month, the first annual rise since March. That is still behind England (up 1.1%), Kent (up 1.5%) and neighbouring Sevenoaks (up 1.0%), and the borough remains £15,024 below its December 2022 peak of £471,251.
Where is the most expensive place to buy near Tunbridge Wells?
Of the parishes with enough sales to measure, Speldhurst was dearest at a median of £800,000 from 46 sales, followed by Brenchley and Matfield at £575,000 and Pembury at £525,000. By postcode sector, TN3 0 reads £837,500.
Where is the cheapest place to buy in Tunbridge Wells borough?
Rusthall, at a median of £380,000 from 65 sales, and then Cranbrook and Sissinghurst at £399,500. At ward level Culverden, just north-west of the station, reads £325,000 from 139 sales, because most of what sells there is flats.
How much is a flat in Tunbridge Wells?
The median flat or maisonette across the borough sold for £250,000 over the twelve months, and £260,000 inside the town. On the House Price Index the borough flat average was £258,513 in July 2026, down 2.0% over the year, the only property type here still falling.
What does a first-time buyer pay in Tunbridge Wells?
An average of £350,900 in July 2026, up 0.6% on the year, against £572,615 for somebody moving from one home to another. Both figures are from the UK House Price Index.
Sources
- UK House Price Index for July 2026, HM Land Registry, published 16 September 2026, for the borough average, property-type and buyer-type figures and the annual and monthly changes.
- Land Registry UK HPI open data, Tunbridge Wells, July 2026 and the matching records for Sevenoaks, Tonbridge and Malling, Wealden, Maidstone, Ashford, Kent, the South East and England for the comparison table and the index values.
- HM Land Registry Price Paid linked data for the parish, ward, property-type, sector and extreme figures, being every completed residential sale recorded in the TN1, TN2, TN3, TN4, TN5, TN12, TN17 and TN18 postcode districts between 1 July 2025 and 30 June 2026, with each postcode matched to its parish, ward and council area through the postcodes.io lookup so that only Tunbridge Wells borough sales are counted.
- HM Land Registry price paid search to check any individual address.
Land Registry figures are provisional and are revised as more sales complete; the index runs two to three months behind, and the most recent months of price paid data are under-counted because sales take time to register. Confirm the latest numbers against the linked sources before making a decision. What is being built near you is on Tunbridge Wells planning news; what the commute costs is on Tunbridge Wells trains to London.
Have your say